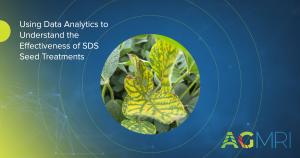
As farmers and agronomists continue to seek the most effective solutions for managing sudden death syndrome (SDS) in soybeans, a farmer in Illinois asked for help evaluating whether one seed treatment offered a distinct advantage. The goal was to determine if a higher-cost treatment could provide a measurable benefit in managing SDS despite its increased price in the local market.
The Challenge: Measuring Effectiveness Amidst Environmental Factors
At first glance, the question seems simple—does one seed treatment outperform another in managing SDS? However, the challenge lies in the numerous environmental factors influencing the disease. Yield alone is not always a reliable metric for measuring the effectiveness of a seed treatment. For example, even a slight advantage of a product—such as two bushels per acre—can be difficult to isolate amidst variables like soil quality, weather conditions, and overall crop health.
Key Observation: Influence of Slope Direction
During the analysis, an interesting pattern emerged: fields with slopes facing north or east seemed to experience more severe symptoms of sudden death syndrome. This observation prompted further investigation into how the field’s orientation might affect the development of SDS.

Leveraging Data: Aspect, NDVI, and Nutrient Deficiency Analysis
Detailed reports were generated using advanced data analytics tools to explore this further, separating field slopes by direction (north, east, south, and west) and incorporating plant health analytics from remote sensing.
By analyzing the data this way, the team could correlate rapid declines in NDVI with drops in nutrient levels, enabling more precise identification of SDS occurrences compared to relying solely on yield data.
The Findings: Seed Treatment Advantage
The results were clear. Comparing the two treatments revealed that one treatment offered a significant advantage in managing SDS. Fields treated with this product showed better resistance to the disease, as reflected by higher NDVI readings and fewer signs of nutrient deficiencies as the growing season progressed. A yield advantage of the winning product also was associated with NDVI improvement.
Exciting Implications for Data-Driven Decision Making
With the right tools, AGMRI Analyze can help farmers make more data-driven decisions about which seed treatments best suit their field conditions. By understanding how factors like slope direction, nutrient levels, and NDVI interact, data analytics can better predict where and when SDS will occur, allowing farmers to choose the most effective treatment.

In conclusion, while one treatment may come with a higher cost, the data demonstrates its significant advantage in managing sudden death syndrome in soybeans. Utilizing such data helps farmers make more cost-effective decisions while gaining deeper insights into crop health beyond simple yield metrics.
Stay tuned for more updates as new ways to harness data analysis in agriculture are explored throughout the season.


