By: Jordi Oliver, Ground Truthing Intern and senior at the University of Illinois studying Agricultural Leadership, Education, and Communications
Staying ahead of crop disease is important for maintaining healthy yields. At Intelinair, we understand the importance of early disease detection and proactive management.
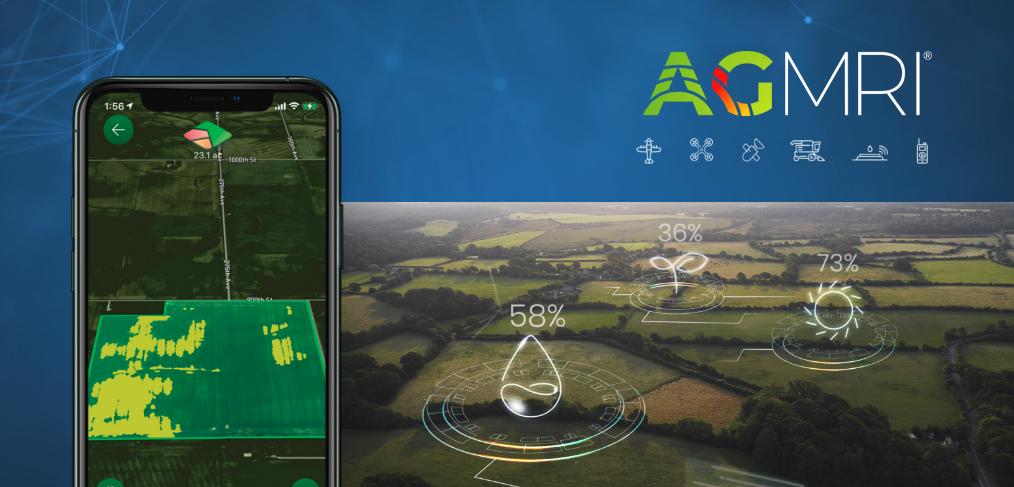
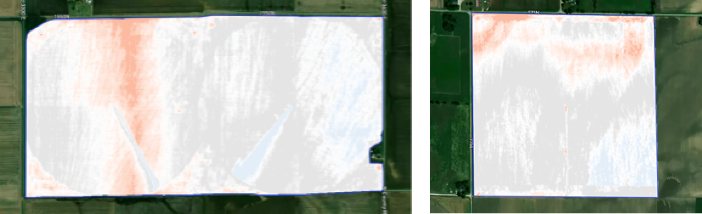
Our AGMRI technology helps visualize and direct you to the areas with the potential for crop diseases before they become a significant threat. By signaling these areas early, AGMRI can provide information to determine the best course of action, whether it is spraying, switching varieties, or other management practices.
While serving as a Ground Truthing Intern, I have learned about numerous potential threats that may affect corn fields. I wanted to share some of my favorite online resources to help understand some common diseases found in the Midwest, how to identify them and evaluate whether spraying is worth it, and planning tips for future success.
Helpful Crop Disease Resources:
- https://extension.illinois.edu/sites/default/files/managing_diseases_2022web.pdf
- https://extension.entm.purdue.edu/newsletters/pestandcrop/
- https://crops.extension.iastate.edu/pests/diseases
- https://crops.extension.iastate.edu/node/1871
- https://indianafieldcroppathology.com/corn/
- https://extension.entm.purdue.edu/newsletters/pestandcrop/article/field-crop-disease-update-in-indiana/
- https://extension.entm.purdue.edu/newsletters/pestandcrop/article/field-crop-disease-resources-for-indiana/
How Intelinair Can Help with Disease Management
Insights: With AGMRI technology, you have access to insights to see what areas of the field might need a closer look. Then, you can make decisions to possibly move up a fungicide application or apply a second fungicide.
Convenient & Easy to Use: You can visualize crop disease indicators or disease in your fields from anywhere from your phone, allowing you to take timely action.
Postseason Analysis: Review the season to see when and where disease indicators were present and understand their impact on yield for next year’s planning.
Learn more about crop disease and AGMRI from our video library.
Stay ahead of crop diseases with support from Intelinair every step of the way. For more information on how AGMRI can support your disease management program, visit with an Intelinair territory manager or email customersuccess@intelinair.com. Follow us on our social media channels to stay up to date.
Read part 1 of Jordi’s blog on AGMRI and disease management here.