Join Us at Tech Hub LIVE Conference & Expo -The Premier Event Advancing Tech Enabled Agriculture
dots-horizontal

Join Us at Tech Hub LIVE Conference & Expo – The Premier Event Advancing Tech Enabled Agriculture

Tech Hub LIVE Conference & Expo is a two-day event that delivers data-driven solutions for practitioners to implement THIS growing season by bringing together the largest gathering of thought leaders and innovative practitioners dedicated to turning new technology opportunities into practical business advantages.

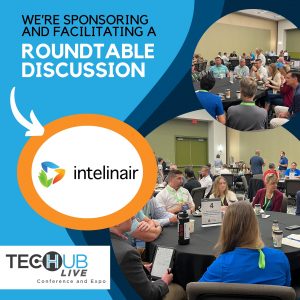
The event takes place July 29-31 at the Iowa Events Center in Des Moines. If you are planning to attend, visit with Intelinair team members, Kevin Krieg and Kade Schmidt at exhibit #316 in the Expo.

Also, grab breakfast and join Kevin Krieg at the roundtable discussion “Redefining Customer Communications with Technology for Improved ROI” on Wednesday, July 31, at 8-8:50 a.m., in Room 315-316 at the Iowa Events Center.

OTHER EVENT HIGHLIGHTS:

  • Top Gun Theme Welcome Party, Breakfast, Lunch, and Cocktail Reception
  • All Farmer’s Panel: Insights from the Field: Farmers’ Perspectives on Ag Tech and Retailer Relationships 
  • Retailer Executive Think Tank (New!): Identifying Opportunities and Delivering Value in a Dynamic Market
  • Speakers: From various companies
  • Roundtable Discussions over Breakfast
  • Fireside Chats: 10-minute chats from experts including CropLife 100 companies
  • Tech Talks: 10-minute talks on the latest solutions to advance your business
  • Workshops (New!): Drones 101 (with demonstrations) and Biological Products for Row Crops 101 (additional fee)
  • Women in Ag TechAdd on the WiAT meeting to network and hear insights from leaders in the field


Learn more about the event or to register, go here.

We look forward to seeing you there!

Share This Article

RELATED BLOG POSTS

[pdf-embedder url=”https://www.intelinair.com/wp-content/uploads/2024/10/Topography-Layer.pdf”

Yield Forecast

Understand where your corn yield is based on the current state of the crop. As the season unfolds, see how it is having an impact on your final yield.

Yield Loss

Powered by years of Nitrogen research at the University of Missouri, our corn Yield Loss analytic, powered by NVision Ag, gives insight into potential yield loss due to Nitrogen deficiency. Optional analytic for nitrogen management.

Variable Dry Down

variable dry down

Understand which fields and which areas of the field are drying down to help plan your harvest logistics.

Underperforming Area

low crop health

Not all areas of your fields perform the same and low NDVI doesn’t necessarily mean there is anything you can do to fix it this year. Underperforming Area alerts you to the fields and areas of the fields that are performing below their historical potential. This will allow you to quickly find those fields and areas and make adjustments to get them back on target and protect yield.

Nutrient Deficiency

nutrient deficiency

As the crop grows, it can tell us more of what is wrong with it. This analytic finds the fields and areas of the fields where there is a nutrient deficiency so that issues can be addressed before grain fill.

Disease Stress

disease risk

In conjunction with the Thermal Stress, Disease Stress alert takes into account weather information to more precisely indicate the type of stress impacting the crop.

Thermal Stress

thermal risk

Using our thermal imagery, AGMRI can detect elevated heat patterns of the crop that indicate crop stress.

Crop Health

Crop Health

Get a complete view of your farms and fields and identify where yield potential is ranked highest to the lowest.

Weed Map & Weed Escape

weed escape

Know what fields and areas of the fields have weeds. With machine integration or based on planting date, be alerted to what fields have weeds that may be impacting yield.

Historical Field Performance

AGMRI creates 5 performance zones in each field based on the historical average of those zones. This data is used to compare the current season to help understand where you are underperforming from the zone potential.

Low Emergence

low emergence

Notification of what fields and areas of the field have poor emergence.

Stand Assessment

strand assessment

AGMRI detects the established rows and uses computer vision and machine learning to determine the best segment of row and compares the rest of the field to that segment to give you a relative map. If machine data is integrated, a stand population map is returned.