dots-horizontal

AGMRI Featured on the Ag News Daily Podcast

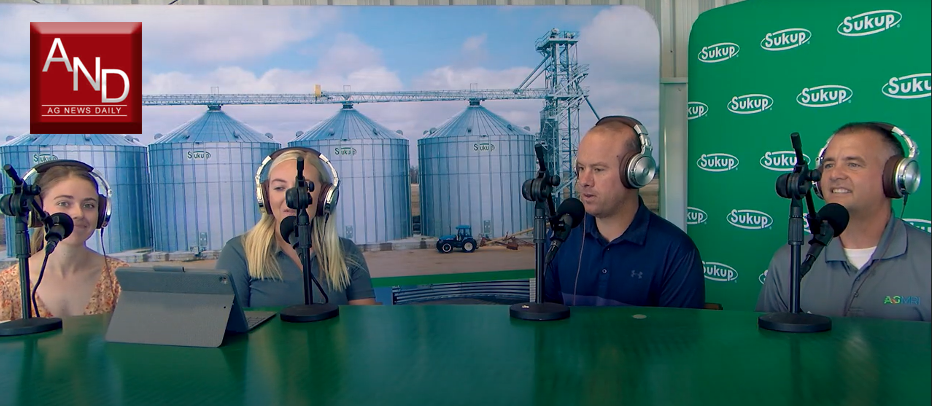
We are excited to share that we were a featured guest on a recent podcast episode of Ag News Daily with hosts Delaney Howell and Michelle Stangler.

Meeting up at the Farm Progress Show in Boone, Iowa, Matthew Burt, a sixth-generation farmer from Central Iowa, and Kevin Krieg discussed how AGMRI provides season-long coverage and insights to identify and quantify yield-limiting issues in the field and shared insights on using AGMRI for nutrient management.

Matthew Burt commented, “The reason I wanted this [on my farm] was to be able to make decisions in season or learn about those trouble spots before the end of the season. If you’re not yielding or if you only see the result at the end you don’t really know how the corn isn’t yielding…it could be any number of issues. And, by having these images coming into my phone, I can actually go out right away and try to learn about the crops, learn if there is crop stress or there’s a nutrient deficiency problem. It helps create some efficiencies, so you’re not having to scout every field, you’re picking those areas that maybe are waving that red flag or need attention.

I’ve actually been able to see something on my phone and then I can go right out to that spot in my field and see that I do have nutrient deficiency. Getting these images for all my fields, I can go to the acre or the corner of the field that I know has a problem and I don’t have to essentially walk every single field to find problems.

It’s really hard to quantify how much of the field had nitrogen loss but what I’m seeing from the imaging and AI tools, it can actually quantify those numbers. It’s not just, yes, there was nitrogen loss or, yes, this field had emergence issues. They are actually putting a number on it.”

Hear more from Kevin and what Matthew learned from AGMRI and how he used it to make in-season decisions this season.

You can find the full-length video here. Our segment starts at 15:23.

Or, listen to the full-length podcast here or wherever you get your podcasts.

Interested in learning more about AGMRI, contact us.

Share This Article

RELATED BLOG POSTS

[pdf-embedder url=”https://www.intelinair.com/wp-content/uploads/2024/10/Topography-Layer.pdf”

Yield Forecast

Understand where your corn yield is based on the current state of the crop. As the season unfolds, see how it is having an impact on your final yield.

Yield Loss

Powered by years of Nitrogen research at the University of Missouri, our corn Yield Loss analytic, powered by NVision Ag, gives insight into potential yield loss due to Nitrogen deficiency. Optional analytic for nitrogen management.

Variable Dry Down

variable dry down

Understand which fields and which areas of the field are drying down to help plan your harvest logistics.

Underperforming Area

low crop health

Not all areas of your fields perform the same and low NDVI doesn’t necessarily mean there is anything you can do to fix it this year. Underperforming Area alerts you to the fields and areas of the fields that are performing below their historical potential. This will allow you to quickly find those fields and areas and make adjustments to get them back on target and protect yield.

Nutrient Deficiency

nutrient deficiency

As the crop grows, it can tell us more of what is wrong with it. This analytic finds the fields and areas of the fields where there is a nutrient deficiency so that issues can be addressed before grain fill.

Disease Stress

disease risk

In conjunction with the Thermal Stress, Disease Stress alert takes into account weather information to more precisely indicate the type of stress impacting the crop.

Thermal Stress

thermal risk

Using our thermal imagery, AGMRI can detect elevated heat patterns of the crop that indicate crop stress.

Crop Health

Crop Health

Get a complete view of your farms and fields and identify where yield potential is ranked highest to the lowest.

Weed Map & Weed Escape

weed escape

Know what fields and areas of the fields have weeds. With machine integration or based on planting date, be alerted to what fields have weeds that may be impacting yield.

Historical Field Performance

AGMRI creates 5 performance zones in each field based on the historical average of those zones. This data is used to compare the current season to help understand where you are underperforming from the zone potential.

Low Emergence

low emergence

Notification of what fields and areas of the field have poor emergence.

Stand Assessment

strand assessment

AGMRI detects the established rows and uses computer vision and machine learning to determine the best segment of row and compares the rest of the field to that segment to give you a relative map. If machine data is integrated, a stand population map is returned.