dots-horizontal

Effective Management of Tar Spot in Corn through AGMRI Insights

Background

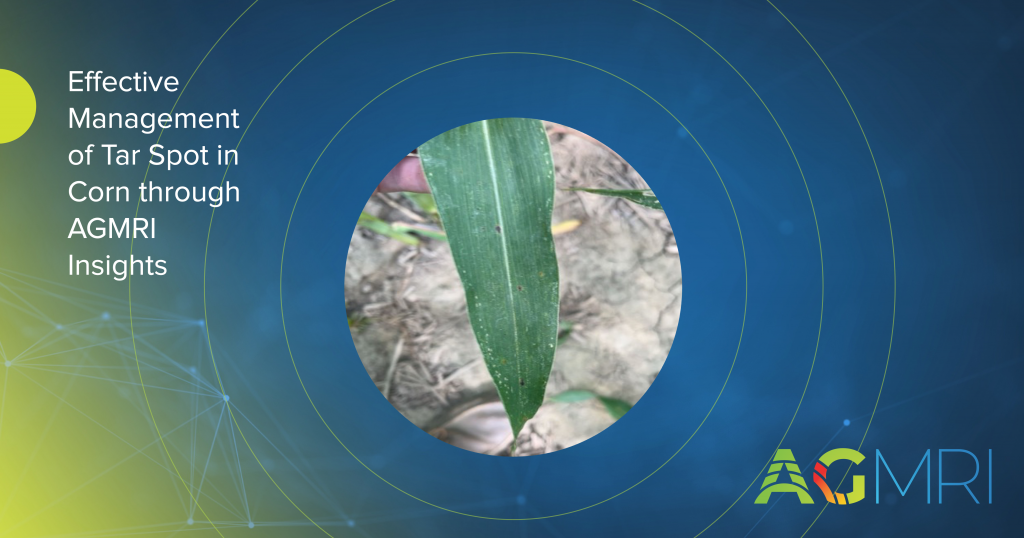
An Indiana grower manages a significant amount of corn planted on corn-on-corn ground. In 2023, he faced a severe outbreak of tar spot, a fungal disease known to reduce yield and quality in corn crops. Aware of the persistent nature of this disease, the grower anticipated a renewed threat this growing season, especially considering he chose to plant corn again.

As the season progressed, he closely monitored his fields for any signs of disease. The weather posed additional challenges, with increased humidity and temperature fluctuations during critical growth stages, further heightening the risk of tar spot re-emerging. The grower’s experience from the previous year made him particularly vigilant; he was acutely aware of how untimely fungicide applications could result in significant yield losses.

Challenge

Despite his proactive approach, the grower faced uncertainty regarding the onset of tar spot pressure in his fields. While he knew the disease would likely return, he needed precise information on when and where to intervene with fungicide applications. This ambiguity raised concerns about potential yield losses if the disease went unchecked, particularly in the critical weeks leading up to tasseling.

To inform his decision-making, the grower utilized a thermal layer map from AGMRI, specifically from a flight on July 22nd. The map revealed unusual striping patterns across the field due to temperature variations. Notably, a wispy red pattern in the middle of the field indicated a concentrated area of thermal stress, correlating with the spread of tar spot.

The grower was on the fence about when to apply fungicide to ensure maximum efficacy. The challenge was to translate the thermal data into actionable insights that would enable him to combat the disease effectively.

Solution

AGMRI provided crucial assistance by allowing the grower to visualize the thermal map, highlighting the areas with heightened disease pressure. Once the tar spot was identified, he decided to apply fungicide to the affected sections of the field. He knew that prompt action would enhance his chances of mitigating yield loss.

With the support of AGMRI’s data, the grower confidently scheduled the fungicide application. Although he was still awaiting specific details on the product used, the timeliness of the intervention was paramount.

Tar-Spot-Use-Case-Thermal
Thermal image showing wispy patterns, indicating potential disease.
Tar-Spot-Use-Case-RGB
July 26 Scouting pin showing tar spot

Results

The application of fungicide, driven by insights from AGMRI, allowed the grower to prioritize his actions based on real-time data. He noted a significant improvement in disease management and is optimistic about the potential return on investment (ROI) from the timely application.

Reflecting on the experience, he added, “AGMRI’s insights have been invaluable in helping us prioritize our fungicide applications. We’re much better equipped to detect diseases early and act before they escalate. Moving forward, I plan to leverage AGMRI data to enhance our decision-making processes and improve overall productivity.”

The grower plans include a more strategic approach to field management, utilizing AGMRI’s insights for ongoing disease monitoring and resource allocation, ensuring efficiency during busy times of the growing season.


View the Full Use Case

Share This Article

RELATED BLOG POSTS

[pdf-embedder url=”https://www.intelinair.com/wp-content/uploads/2024/10/Topography-Layer.pdf”

Yield Forecast

Understand where your corn yield is based on the current state of the crop. As the season unfolds, see how it is having an impact on your final yield.

Yield Loss

Powered by years of Nitrogen research at the University of Missouri, our corn Yield Loss analytic, powered by NVision Ag, gives insight into potential yield loss due to Nitrogen deficiency. Optional analytic for nitrogen management.

Variable Dry Down

variable dry down

Understand which fields and which areas of the field are drying down to help plan your harvest logistics.

Underperforming Area

low crop health

Not all areas of your fields perform the same and low NDVI doesn’t necessarily mean there is anything you can do to fix it this year. Underperforming Area alerts you to the fields and areas of the fields that are performing below their historical potential. This will allow you to quickly find those fields and areas and make adjustments to get them back on target and protect yield.

Nutrient Deficiency

nutrient deficiency

As the crop grows, it can tell us more of what is wrong with it. This analytic finds the fields and areas of the fields where there is a nutrient deficiency so that issues can be addressed before grain fill.

Disease Stress

disease risk

In conjunction with the Thermal Stress, Disease Stress alert takes into account weather information to more precisely indicate the type of stress impacting the crop.

Thermal Stress

thermal risk

Using our thermal imagery, AGMRI can detect elevated heat patterns of the crop that indicate crop stress.

Crop Health

Crop Health

Get a complete view of your farms and fields and identify where yield potential is ranked highest to the lowest.

Weed Map & Weed Escape

weed escape

Know what fields and areas of the fields have weeds. With machine integration or based on planting date, be alerted to what fields have weeds that may be impacting yield.

Historical Field Performance

AGMRI creates 5 performance zones in each field based on the historical average of those zones. This data is used to compare the current season to help understand where you are underperforming from the zone potential.

Low Emergence

low emergence

Notification of what fields and areas of the field have poor emergence.

Stand Assessment

strand assessment

AGMRI detects the established rows and uses computer vision and machine learning to determine the best segment of row and compares the rest of the field to that segment to give you a relative map. If machine data is integrated, a stand population map is returned.