dots-horizontal

Case Study: Doubling Down on Fungicide

Ag Intelligence in the New Ag of Crop Disease

Tar Spot, which was only discovered in 2015, is capable of destroying up to 100 bu/ac of corn.

Crop disease is a constant threat to farmers’ well-being. In 2018 alone, the Crop Protection Network reported that disease destroyed an astonishing 10.9% of all corn yields across the United States and Ontario, adding up to hundreds of millions of bushels and billions of dollars in losses. And the problem is only getting worse.


Between 2020 and 2021, two new diseases known as Southern Rust and Tar Spot rapidly expanded their reach across the state of Illinois, firmly establishing themselves as persistent threats to corn for the foreseeable future. Both of these are especially deadly to the corn crop, with Southern Rust regularly destroying 20-40 bu/ac and Tar Spot capable of a staggering 50-100 bu/ac. Finding effective ways to combat these diseases is now more important than ever.


Read the full case study.


About IntelinAir, Inc.

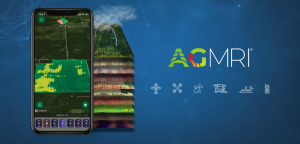
IntelinAir, Inc., the automated crop intelligence company, leverages AI and machine learning to model crop performance and identify problems enabling commercial growers to make improved decisions. The company’s flagship product, AGMRI® aggregates and analyzes data including high resolution aerial, satellite, and drone imagery, equipment, weather, scouting, and more to deliver actionable Smart Alerts on specific problems in areas of fields as push notifications to farmers’ smartphones. The proactive alerts on operational issues allow farmers to intervene, rescue yield, capture learnings for the next season, and identify conservation opportunities for sustainable farming. Annually IntelinAir analyzes millions of acres of farmland, helping growers make thousands of decisions for improved operations and profitability. For more information, follow IntelinAir on LinkedIn, Facebook, Twitter, and Instagram and visit https://www.intelinair.com/.

®Trademark of IntelinAir, Inc.

#AgMRI #Intelinair #RowTracer #WeedWatch #HeatSeeker #TrendZone #YieldRisK #HelpingFarmersProsper #TransformingGlobalAg

Share This Article

RELATED BLOG POSTS

[pdf-embedder url=”https://www.intelinair.com/wp-content/uploads/2024/10/Topography-Layer.pdf”

Yield Forecast

Understand where your corn yield is based on the current state of the crop. As the season unfolds, see how it is having an impact on your final yield.

Yield Loss

Powered by years of Nitrogen research at the University of Missouri, our corn Yield Loss analytic, powered by NVision Ag, gives insight into potential yield loss due to Nitrogen deficiency. Optional analytic for nitrogen management.

Variable Dry Down

variable dry down

Understand which fields and which areas of the field are drying down to help plan your harvest logistics.

Underperforming Area

low crop health

Not all areas of your fields perform the same and low NDVI doesn’t necessarily mean there is anything you can do to fix it this year. Underperforming Area alerts you to the fields and areas of the fields that are performing below their historical potential. This will allow you to quickly find those fields and areas and make adjustments to get them back on target and protect yield.

Nutrient Deficiency

nutrient deficiency

As the crop grows, it can tell us more of what is wrong with it. This analytic finds the fields and areas of the fields where there is a nutrient deficiency so that issues can be addressed before grain fill.

Disease Stress

disease risk

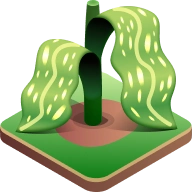
In conjunction with the Thermal Stress, Disease Stress alert takes into account weather information to more precisely indicate the type of stress impacting the crop.

Thermal Stress

thermal risk

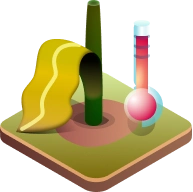
Using our thermal imagery, AGMRI can detect elevated heat patterns of the crop that indicate crop stress.

Crop Health

Crop Health

Get a complete view of your farms and fields and identify where yield potential is ranked highest to the lowest.

Weed Map & Weed Escape

weed escape

Know what fields and areas of the fields have weeds. With machine integration or based on planting date, be alerted to what fields have weeds that may be impacting yield.

Historical Field Performance

AGMRI creates 5 performance zones in each field based on the historical average of those zones. This data is used to compare the current season to help understand where you are underperforming from the zone potential.

Low Emergence

low emergence

Notification of what fields and areas of the field have poor emergence.

Stand Assessment

strand assessment

AGMRI detects the established rows and uses computer vision and machine learning to determine the best segment of row and compares the rest of the field to that segment to give you a relative map. If machine data is integrated, a stand population map is returned.