
By: Jordi Oliver, Ground Truthing Intern, Senior at the University of Illinois studying Agricultural Leadership, Education, and Communications.
AGMRI’s model is helping farmers to identify potential issues in the field and forecast their yield. This blog highlights how the features are used, what to look for, and the numerous benefits it offers.
What Makes up the Yield Forecast Model
The creation of the AGMRI yield forecast model is a process that brings together multiple data sources and advanced technologies. Here’s an overview of how it’s done:
- Data Collection: The foundation of the model is high-resolution aerial imagery collected throughout the growing season. This imagery captures detailed information about crop health, growth stages, and irregularities.
- Data Integration: Alongside aerial imagery, the model uses historical weather data, field-specific features, and planting data. This combination enriches the dataset, offering a more nuanced view of each field’s unique environment.
- Deep Learning Model: The model utilizes advanced deep learning algorithms specifically developed to identify patterns indicative of potential yield loss. It has been trained on a large dataset encompassing a diverse range of historical field conditions and weather scenarios, enhancing its predictive precision and reliability.
- Yield Prediction: In this phase, the model uses the data collected in the first two steps to make yield predictions. This ongoing analysis helps maintain the accuracy of yield forecasts as new data becomes available.
Three Ways to Use the Yield Forecast Model
The AGMRI platform makes it easy for farmers to use the yield forecast model. Here’s how it works:
- Field Monitoring: Monitor fields remotely through AGMRI. The platform provides detailed insights into crop health, growth stages, and potential issues such as nutrient deficiencies.
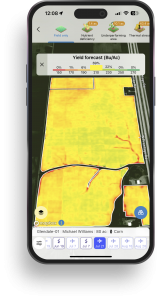
- Yield Predictions: The yield forecast model generates predictions that help you understand potential yield outcomes. These predictions are based on the latest data, providing accurate and up-to-date information.
- Decision Support: By analyzing the yield forecasts, you can make informed decisions about irrigation, fertilization, disease, and harvesting schedules, as well as marketing and storage considerations. This proactive approach helps optimize resource use and protect yield potential.
What to Look For in AGMRI
When using Intelinair’s yield forecast model, you should pay attention to several key factors:
- Irregularities: Look out for any irregularities generated by the model. These could indicate potential issues that require immediate attention.
- Trend Analysis: Analyze trends over time to understand how different factors influence yield outcomes. This can help in refining management practices for better results in future growing seasons.
Top Five Benefits
The yield forecast model offers a range of benefits that can significantly enhance productivity:
- Optimized Resource Use: By providing precise information on crop needs, the model helps in optimizing the use of water, fertilizers, and product placement decisions.
- Improved Yield: With accurate yield predictions, there is time to implement timely interventions to address issues and protect yield potential.
- Enhanced Planning: The ability to forecast yields allows for better planning of harvest schedules, labor, and logistics, ensuring improved efficiency.
- Risk Management: The model helps identify potential weather dangers and other risks, enabling proactive measures to mitigate impact.
By integrating advanced technologies and predictive analytics, this model is paving the way for more efficient and productive real-time decision-making and planning for future crop years. For more information on how to use AGMRI for forecasting yield, visit with a territory manager or book a time via customersuccess@intelinair.com. Follow us on our social media channels to stay up to date on AGMRI!