dots-horizontal

Early Season Stand Evaluation

As crops begin to emerge, it is wise to take time to evaluate your stand, confirm plant population, and ensure your investment is off to the best possible start. This typically involves taking stand counts, digging up seedlings, and checking overall plant health. This is really the first time you are getting a close-up view of your new crop. And, if done early enough, there is still time to potentially replant or make early season fertility adjustments that could help your crop and protect your yield.


Stand Count vs. Stand Evaluation – What’s the Difference?

When thinking about evaluating your crops post emergence, there are two tools to help you evaluate your crop – stand count and stand assessment.

  • Stand count is counting every emerged plant, regardless of what stage it is in, or the health of the plant at the time of the stand count. This means that if the plant has emerged or is out of the ground, It will be counted toward the overall stand count total.

  • Stand assessment involves evaluating the plants that you determine have emerged, and evaluating the overall health, viability, and growth stage compared to the other plants in the same 17’ 5” area.


In Field Scouting Tip

Before taking a stand count, it is important to take into consideration your row width, as this will be key in accurately determining your plants per acre across the field. For example, in 30” spaced rows, 1/1000th of an acre is 17’5” with that number changing based on different row widths. This means that if you count 35 plants within that 17’5”, you have approximately 35,000 plants per acre.

To get the most accurate representation of the field average, it is best to do a stand count in various spots throughout the field and to have at least 3-5 stand counts in total.

The process for stand counts is fairly straightforward; however, the stand assessment is a bit more tedious. This involves going back through the 17’5” in which you just completed a stand count, and determining what plants are struggling, had a planting error (e.g., skips, doubles, no-germ), and what plants may be injured due to crop protection products, fertilizer, potential early season disease, or frost. This helps determine the overall potential for the final stand, and can be a factor in determining yield.


How AGMRI can Help Track Stand

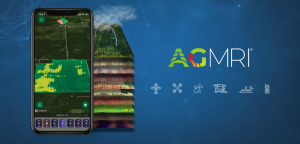
By utilizing AGMRI, an emergence map will be created on enrolled fields, potentially limiting the amount of time spent performing in-person field stand counts. By using 15 cm resolution imagery, and a growing degree day calculator (based on planting date), AGMRI can give you an estimated stand count representation by as early as V4.

Contact us for more information.

Share This Article

RELATED BLOG POSTS

[pdf-embedder url=”https://www.intelinair.com/wp-content/uploads/2024/10/Topography-Layer.pdf”

Yield Forecast

Understand where your corn yield is based on the current state of the crop. As the season unfolds, see how it is having an impact on your final yield.

Yield Loss

Powered by years of Nitrogen research at the University of Missouri, our corn Yield Loss analytic, powered by NVision Ag, gives insight into potential yield loss due to Nitrogen deficiency. Optional analytic for nitrogen management.

Variable Dry Down

variable dry down

Understand which fields and which areas of the field are drying down to help plan your harvest logistics.

Underperforming Area

low crop health

Not all areas of your fields perform the same and low NDVI doesn’t necessarily mean there is anything you can do to fix it this year. Underperforming Area alerts you to the fields and areas of the fields that are performing below their historical potential. This will allow you to quickly find those fields and areas and make adjustments to get them back on target and protect yield.

Nutrient Deficiency

nutrient deficiency

As the crop grows, it can tell us more of what is wrong with it. This analytic finds the fields and areas of the fields where there is a nutrient deficiency so that issues can be addressed before grain fill.

Disease Stress

disease risk

In conjunction with the Thermal Stress, Disease Stress alert takes into account weather information to more precisely indicate the type of stress impacting the crop.

Thermal Stress

thermal risk

Using our thermal imagery, AGMRI can detect elevated heat patterns of the crop that indicate crop stress.

Crop Health

Crop Health

Get a complete view of your farms and fields and identify where yield potential is ranked highest to the lowest.

Weed Map & Weed Escape

weed escape

Know what fields and areas of the fields have weeds. With machine integration or based on planting date, be alerted to what fields have weeds that may be impacting yield.

Historical Field Performance

AGMRI creates 5 performance zones in each field based on the historical average of those zones. This data is used to compare the current season to help understand where you are underperforming from the zone potential.

Low Emergence

low emergence

Notification of what fields and areas of the field have poor emergence.

Stand Assessment

strand assessment

AGMRI detects the established rows and uses computer vision and machine learning to determine the best segment of row and compares the rest of the field to that segment to give you a relative map. If machine data is integrated, a stand population map is returned.