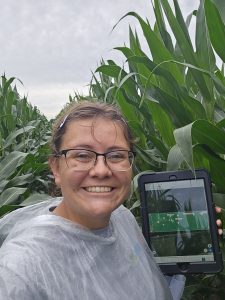
By: Jordan “Jordi” Oliver, Ground Truthing Intern, Senior at the University of Illinois studying Agricultural Leadership, Education, and Communications
As we navigate through the crop year, staying ahead of potential threats like diseases becomes increasingly crucial. At Intelinair, we provide cutting-edge solutions to equip farmers with the necessary insights required to produce more stable yields.
As a Ground Truthing Intern at Intelinair, I have gained valuable insights into proactive field scouting techniques using AGMRI technology.
In the past several weeks, I have walked through fields and seen the growth and development of our crops in real-time. With our wet spring, I have had the opportunity to learn about disease and see it developing in the early stages in the fields and appearing through our imagery technology. Here are a few practical tips on identifying and managing potential diseases in your fields.
Tip #1: Utilizing AGMRI for Early Detection
One of the primary advantages of AGMRI is its ability to provide aerial scans of your fields. When analyzing these images, our first step is to inspect the entire field. We pay close attention to any irregularities, such as bare spots or terrain variations, which could impact the accuracy of our data.
Tip #2: Understanding the Role of Topography and Water Areas
Understanding the topography of your fields is essential. Areas with higher elevations typically have lower disease risks compared to low-lying sections, where water can accumulate and create favorable conditions for diseases to thrive. These spots often serve as breeding grounds for diseases, demanding heightened vigilance and targeted monitoring.
Tip #3: Gaining Insights from Thermal Imaging
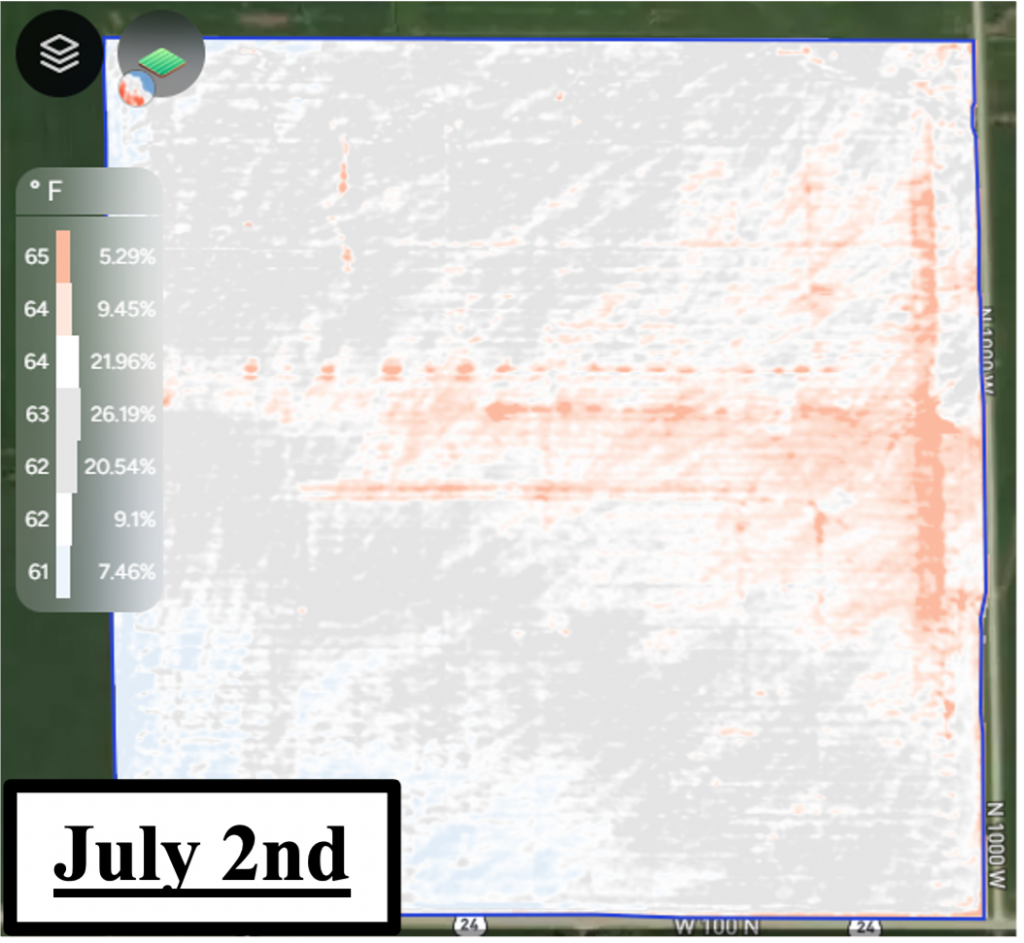
Thermal imaging is a game-changer in disease detection. By analyzing thermal patterns, we can pinpoint potential disease outbreaks before they become visible to the naked eye. Areas displaying red patterns indicate potential disease hotspots, prompting us to conduct further on-ground inspections. As shown in the example below from July 2, disease can be observed as a red streaking pattern moving across the field.
Tip #4: Taking Action
Once potential disease areas are identified through AGMRI, action is key. Proactive scouting and monitoring allow us to detect diseases like Tar Spot, Corn Leaf Blight, Grey Leaf Spot, and many others early on. This proactive approach gives you the advantage of addressing issues swiftly, minimizing crop damage, and optimizing yield potential.
Intelinair’s AGMRI technology is designed to give you a comprehensive view of your fields, enabling informed decision-making and proactive crop management.
For more information on how AGMRI can benefit your operation, visit with an Intelinair territory manager or email us at customersuccess@intelinair.com. Follow us on our social media channels to stay up to date!